PSO-LocBACT
A Software for
Optimizing Multiple Classifier Results for Predicting Subcellular Localization
of Bacterial Proteins
Introduction
of PSO-LocBact
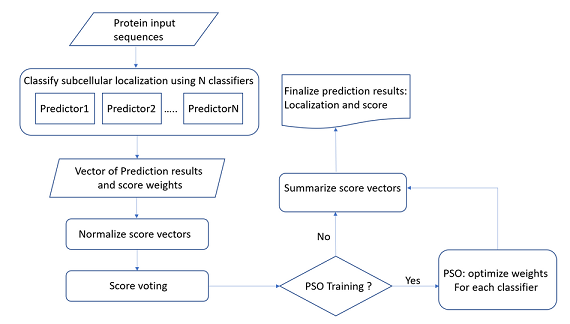
PSO-LocBact is a predictor based on Particle Swarm Optimization
which predicts protein locations specifically in bacteria. This program can
predict 5 distinct locations on gram-negative (Extracellular region, Outer
membrane, Periplasm, Inner/Cytoplasmic membrane, Cytoplasm) and 4 distinct
locations on gram-positive (Extracellular region, Cell wall,
Inner/Plasma/Cytoplasmic membrane, Cytoplasm) bacterial data sets. It can solve
inconsistency problem in gram-negative and gram-positive bacterial protein
subcellular localization prediction. This program can be easily updated with
new classifiers integration.
Installation
The PSO-LocBact package can be run on Linux, Mac, and Windows
systems. Download the package from the link provided and extract it to a
directory, for example, “~/usr”. To execute the PSO-LocBact in command line environment, navigate to the “~/usr/PSO-LocBact” directory and
you will find four Python scripts (~.py), and one
Perl script (GetResults.pl).
The Perl script
in this directory is for re-arranging prediction result files from other
classifiers, all at once, into a single CSV file containing score vector for
each protein sequence in order of given subcellular locations. For example, in
gram-positive score vector file, the first column will be score for
extracellular region, next for cell wall, next for membrane and the last one
will be cytoplasm. Four columns will be considered as the results from one
classifier. If there are N classifiers considered, the number of columns in the
vector file will be 4xN for gram-positive bacterial proteins and 5xN for
gram-negative bacterial proteins.
Two Python
scripts, normalizer.py and voter.py, contain necessary classes for the final results calculation in the other two Python scripts.
The “train.py” is used to train the training vector file. And, the
“pso_locbact.py” is used to calculate final results
from given vector files according to the settings in “configuration.txt”.
Input formats
The input file
for “pso_locbact.py” must be a score vector file in CSV format with “,”
delimiters. For gram-positive bacterial proteins, four columns will be
considered as resulting scores from one classifier. The order of locations are “extracellular region”, “cell wall”,
“inner/plasma/cytoplasmic membrane”, and “cytoplasm”. For gram-negative
bacterial proteins, five columns will be considered as resulting scores from
one classifier. The order of locations are
“extracellular region”, “outer membrane”, “periplasm”, “inner//cytoplasmic
membrane”, and “cytoplasm”. If there are N classifiers considered, the number
of columns in the vector file will be 4xN for gram-positive bacterial proteins
and 5xN for gram-negative bacterial proteins.
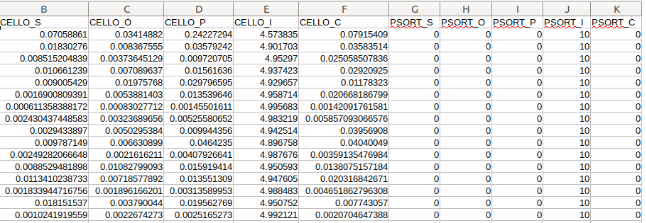
An
example of input format
In order to create a CSV file in this format, a Perl script “GetResults” is provided. All user needs to do is name all
files with the same file name prefix with the program name as a postfix (ie, training.ngLoc,
training.PSORTb3, training.LocTree3.html). However, for LocTree3, user will need
to change a line in ~/Lib/GetLocTree3.
our $original =
"gneg_training_data.fasta";
#change this
Just change the value “gneg_training_data.fasta” to the current directory and filename of the
original FASTA file user used in other classifiers. Then, user may simply open
a command line on the working directory of PSO-BactLoc
and type:
perl GetResults -gramneg prefix
The parameters prefix
and -gramneg are the prefix of all files
generated by other classifiers and a type of bacteria, respectively. If
bacteria type is gram-positive, just change “-gramneg”
to “-grampos”.
Please be noted that our GetResults
script might not work properly. In that case, the order of classifiers for
users to arrange the inputs by themselves is as follows: CELLO, PSORTb3,
CELLO2Go, SOSUI-GramN, SLP-Local, ngLoc,
Gneg-mPloc, PSLpred, and
LocTree3 for gram-negative bacteria; CELLO, PSORTb3, CELLO2Go, ngLoc, Gpos-mPlc, and LocTree3
for gram-positive bacteria.
Output formats
The outputs
from “pso_locbact” consist of two text files, one
containing the prediction results along with weighted score vectors for all
locations, and another containing summary information. If the “pie_chart” setting in “configuration.txt” is set to 1, a
summary pie chart for number of predicted locations of the given data set will
be generated in PNG format.
Download
Link: Data, Standalone Program